Thank you to everyone who took part in the Work and Wellbeing survey in February. We received 1415 responses – very similar to the response rate to the October survey.
As well as checking in on key areas of your wellbeing, the relationship with your manager, and communications, this survey explored preferences for future working arrangements, the value of various work locations and how effectiveness at work could be improved. A report with the findings and proposed next steps was presented to UEB on 23 March 2021.
Here are some of the key messages from the survey.
Wellbeing
In previous surveys we have used the four standard questions from the Office for National Statistics to assess people’s feelings of wellbeing. We used the 1-10 scale where 1 is low and 10 is high.
| ONS Question | University (mean scores) Jun 20 | University (mean scores) Oct 20 | University (mean scores) Feb 21 | UK (mean scores) Jun 20 | UK (mean scores) Oct 20 | UK (mean scores) Feb 21 |
|---|---|---|---|---|---|---|
| How satisfied are you with your life? | 6.6 | 6.5 | 6.2 | 7.1 | 6.8 | 6.4 |
| The things you do in your life are worthwhile? | 7.2 | 6.8 | 6.7 | 7.5 | 7.4 | 7.0 |
| How happy do you feel? | 6.6 | 6.4 | 6.3 | 7.1 | 7.0 | 6.5 |
| How anxious did you feel yesterday? | 4.6 | 5.1 | 4.7 | 3.9 | 4.0 | 4.1 |
We can see a continuing downward trend with the satisfaction measures primarily due to the continued restrictions and school closures. However, the anxiety measure has improved. There are many factors – at a national level the reduction in pandemic cases and efficient vaccine roll-out; at a University level the low level of cases on campus and an acceptance that the University can continue to operate under COVID measures.

The graph shows that in the latest survey staff scored lower on the question 'How happy did you feel yesterday?' compared to June and October last year.
The qualitative remarks highlight a consistent theme around uncertainty, particularly from those whose work pattern has become more focussed away from campus. A significant number of staff said that a timeframe for this way of working would ease anxieties and allow for more sustainable arrangements to be made.
We also asked how proud people are to work for the University, with the intention of using this as a main people KPI. We plan to use longitudinal analysis to determine whether actions are needed in future, but the baseline shows that, on a scale of 1-10, 78% staff score this at ‘6’ or above.
Next steps
A road map for the ‘re-opening’ of campus will be developed to provide guidance on how/when students are expected to return and consequently how/when/where staff will be working including guidance and commitments on flexible working plan.
My Manager
We have relied heavily on the relationship between managers and staff to adapt to these new working patterns and to support staff who will have had to make difficult adjustments to both their home and working life. Overall staff’s attitudes to the way their managers have supported them remain positive but there are increasing levels of dissatisfaction. It is difficult to pin these on one particular cause, though there are slightly higher levels of dissatisfaction in the academic workforce, and in those with childcare responsibilities.
Next steps
Support for managers (skills, knowledge etc.) will be included in the design of any response to the survey findings.
Communications
The investments we have made in communications over the last eight months are reflected very positively in the survey. All three of the questions continue to show improvement and it would appear that we have responded well to the topics which really matter to people.
I feel well informed about the University's response

The graph shows that 74.6% of staff agree or strongly agree with the statement 'I feel well informed about the University's response'.
Future ways of working
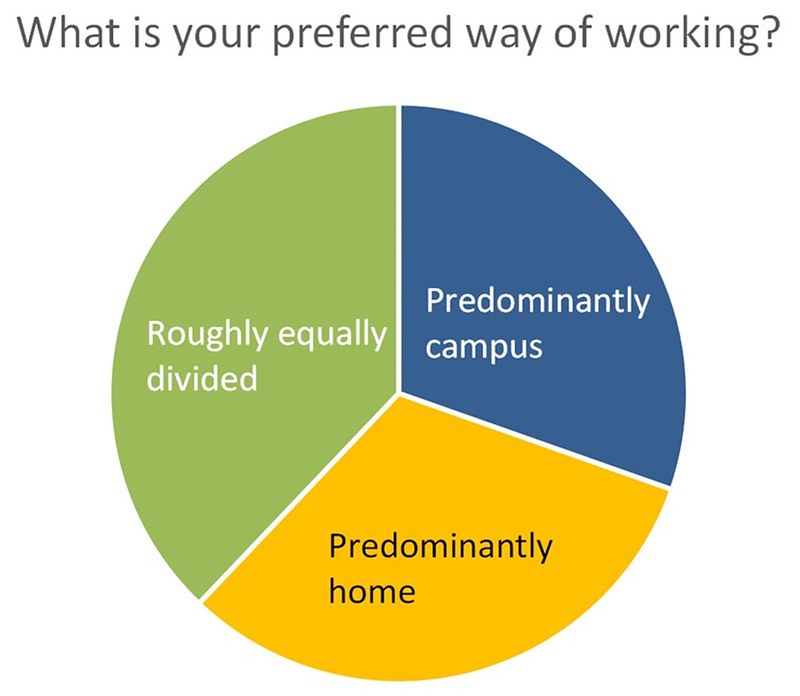
We spent some time with this survey investigating the future of working patterns. The key question asks people to look forward to their preferred way of working when campus is fully ‘open’ again. The results split, roughly equally between the three categories.

The pie chart shows that staff are divided between preferred ways of working with roughly one third choosing 'predominantly from home, one third choosing 'predominantly campus' and one third choosing 'equally divided.
If these are examined by job family, the Operational and Facilities Support (OFS) and Technical and Experimental (T&E) job families are more campus based (60-70%), with Management, Specialist and Administration (MSA) (18%) and Education and Research (E&R) (39%) showing a preference for more home and hybrid forms of working. There is a strong correlation with gender, with 82% of female staff in the E&R and MSA job families preferring remote/hybrid arrangements compared to 64% of male staff.
Next steps
A flexible working plan will be developed balancing the needs of staff, teams and the effective operation of the University.
Valuing different ways of working
We asked what you most valued about working remotely…

The graph shows that saving time and money on the commute, flexibility and ways of working, such as fewer distractions, are the top three things that staff value about working from home.
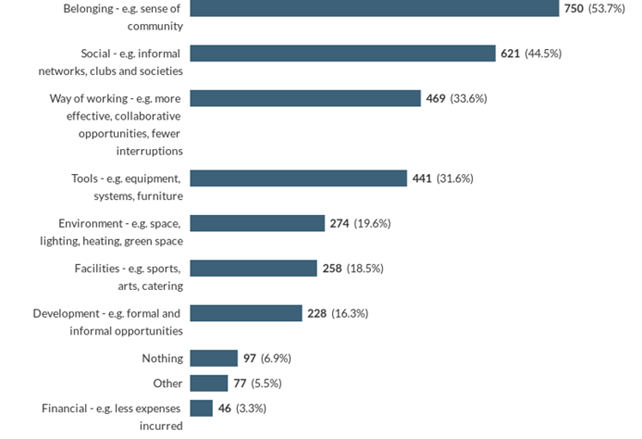
...and what you most valued about working on campus

The graph shows that a sense of community, social interaction and ways of working, such as collaborative opportunities, are the top three things that staff value about working on campus.
Next steps
We are currently exploring potential activities that we may be able to offer over the start of the summer period to provide an opportunity to reengage with colleagues and our vibrant campus community, safely and in line with our commitment to provide a safe environment for all of our staff and students.
We would appreciate you taking the time to complete a brief survey to share your thoughts and feedback about activities you would find most beneficial to your work and wellbeing. Please assist us by completing this brief survey by Tuesday 6 April 2021.
Learnings from this will also inform how this could continue in future flexible-working models.
Working effectively
We have all had to adapt systems, processes and practices rather quickly to allow for different working patterns. These adaptations have identified opportunities (e.g. Teams meetings) and shortcomings (e.g. some of our older IT applications).
Most of the University's systems, processes and practices support me to get my work done effectively

The graph shows that 69.7% of staff agree or strongly agree with the statement 'Most of the University's systems, processes and practices support me to get my work done effectively'.
Next steps
As we move forward, we have the opportunity to review, refresh and optimise some of our systems, processes and practices to create greater productivity and improved effectiveness. Some systems and user experience analysis on specific systems will be undertaken to ensure that they are optimised for flexible working models.
A final word on wellbeing
The opportunity to identify which one thing that the University could do to enhance wellbeing and working life revealed that addressing excessive workload, providing the opportunity for effective flexible working and supporting wellbeing through greater social connection were the most cited requests highlighting the varying and individual experiences of staff during the past year.
Next steps
Plans will be put in place to develop a more comprehensive toolkit for line managers on workload and flexible working to give managers techniques for prioritising and identifying more efficient ways of working.
As we consider and understand the survey data in greater detail we will keep you informed on the solutions being developed and opportunities created to respond to what the survey is telling us.
Download a copy of the appendix to the UEB report.
If you would like the graphs presented on this page in a more accessible format please contact comms@bath.ac.uk.
